Welcome to the first in a new series of blog posts entitled Profiles in Accreditation!
The organizations that COA accredits are diverse in both the communities they serve and their reasons for seeking accreditation (or reaccreditation). Profiles in Accreditation will explore the accreditation experience through the perspective of these organizations. Through them, we can discover the value of accreditation, best practices, lessons learned, and recommendations.
Organization profile
Name: Lad Lake
Locations: Milwaukee and Dousman, Wisconsin
First Accredited: 2014
Reaccredited: 2018
Snapshot: Lad Lake has been evolving to meet the needs of Wisconsin’s most vulnerable children for 170 years. Serving more than 1,200 youth annually, the organization’s 300 staff accomplish its mission of “guiding the growth of at-risk youth to reach their potential and live responsibly” through four major program commitments: two residential care centers for youth who have experienced trauma from the child welfare and juvenile justice systems; alternative education for students with special learning needs; independent living services for youth “aging out” of the foster care system; and community services such as in-home therapy, specialized mentoring, and supervised visitation for parents and children.
Interview with Lad Lake
For our first Profiles in Accreditation post, we asked Lad Lake President and CEO Daniel O. Magnuson, MA, MSW to share his thoughts on his organization’s journey through reaccreditation. He emphasized how accreditation provided a framework for operational success, as well as the importance of having the entire organization–including the board–engaged with the process.
COA: Why was it important to Lad Lake to seek accreditation initially?
DM: We sought our initial accreditation in preparation for the retirement of a long-serving CEO; we wanted to position Lad Lake for improved impact and financial sustainability.
COA: What were some of the drivers for seeking reaccreditation?
DM: As we implemented the initial accreditation plan in 2014-2015, we also completed a comprehensive strategic planning initiative. COA’s accreditation framework helped us to focus and look at activities on an organizational level, which made the execution of our strategic plan more effective. Reaccreditation affirmed our internal sense that we were making significant progress in all domains of our performance, and in a dramatic fashion!
Additionally, accreditation provides Lad Lake with a competitive advantage with many of our stakeholders. This will be increasingly important as the federal Families First Prevention Services Act is implemented.
COA: What about the COA accreditation process made you decide to partner with us?
DM: Our partnership with the Alliance for Strong Families and Communities and our executive leadership’s deep connection with the Alliance network made COA the obvious choice for accreditation. It is the “gold standard” for our industry.
COA: What do you see as the main benefit of COA accreditation?
DM: COA accreditation provides Lad Lake with a framework for (and the discipline to stay focused on) our strategic priorities. It helps us to learn together, to adjust our approaches to achieve our intended impact, and to strengthen our financial sustainability in the face of changing market conditions.
COA: Were there any unexpected results after completing the Self Study and PQI process?
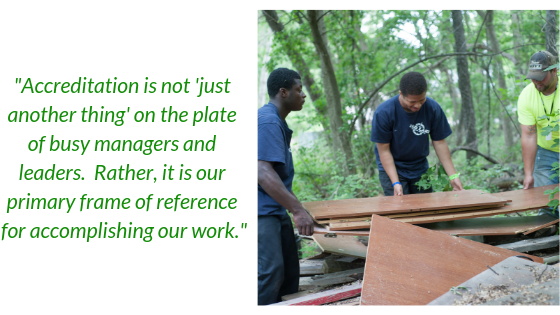
DM: The primary unexpected result was the degree to which Lad Lake’s management teams embraced COA accreditation, especially reaccreditation. The standards, the policies, and the procedures developed in our self-study and PQI processes have, for the most part, become the way Lad Lake does business. Accreditation is not “just another thing” on the plate of busy managers and leaders. Rather, it is our primary frame of reference for accomplishing our work.
Additionally, the COA accreditation and reaccreditation processes were completed in the face of very serious financial challenges. These challenges required the development and execution of a difficult turnaround plan. Rather than distracting our leadership from that plan, COA accreditation provided a disciplined process to focus our attention on the key drivers for our success.
As CEO, I do not believe our financial turnaround, improved quality and financial sustainability could have been possible without the discipline of thought offered by accreditation and reaccreditation.
COA: Why was it important for you to have a high level of stakeholder engagement across your organization?
DM: One element of our organizational vision is to fulfill our mission with an “aligned, engaged, and happy workforce.” This can be a tall order in an industry with such challenging work and shoe-string budgets! The COA process, in concert with a clear strategic plan, helped us to articulate what we wanted employees to align and engage with. It also helped us to communicate those directions across our organization. This has grounded Lad Lake’s daily activities in a larger vision of improving the lives of youth and families in need.
COA: How has COA accreditation/reaccreditation impacted operational success at Lad Lake?
DM: Accreditation and reaccreditation has been transformative for Lad Lake. In concert with our updated strategic plan, COA provided a framework to operationalize and monitor our process improvements across all domains of our organization, from impact to human capital to financial sustainability to governance. A host of key performance indicators focused the work of the board, management, and staff.
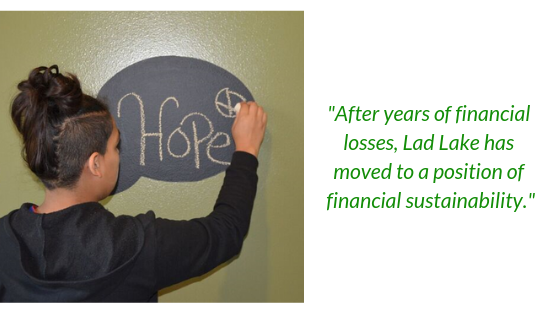
The results have been extraordinary. All our programs now share common goals in safety, health, social support, and hopeful futures. Process improvement is closely tracked with client feedback and validated assessment methodologies. Findings inform refinements in program design. Risk management in many key areas has dramatically improved. After years of financial losses, Lad Lake has moved to a position of financial sustainability.
COA: How did you communicate the value of accreditation and engage the entire organization during the accreditation process?
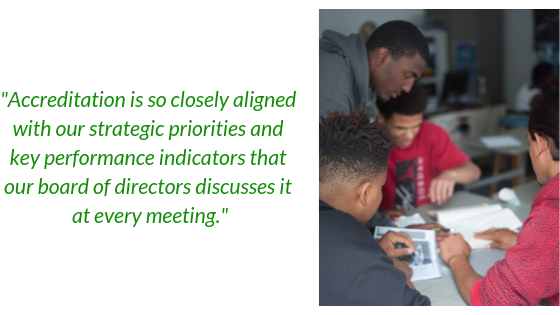
DM: We did so in various ways. Firstly, many managers and supervisors were (and are still) involved in various teams devoted to quality improvement and risk management. Internal communication methods such as staff newsletters, email communication, and face-to-face meetings helped to extend the accreditation story to team members. Accreditation at Lad Lake is so closely aligned with our strategic priorities and key performance indicators that our board of directors discusses it at every meeting.
COA: At the board level, what were the driving factors for seeking accreditation?
DM: The board was particularly interested in accreditation to help it better understand and address the impact of the organization’s services on youth and families. The pending retirement of a CEO and the prospect of a new CEO coming aboard added extra urgency to Lad Lake’s initial pursuit of it.
COA: What was the biggest challenge for the board during the accreditation process?
DM: The board fully embraced accreditation. They understood its value and likened the process to quality initiatives and accreditation in their respective industries. Linking accreditation to our strategic planning and turnaround agenda required careful attention, but accreditation helped, not hindered, that process.
COA: What are the top three tips that you would give to an organization considering or currently undertaking the accreditation process for the first time?
DM: I would advise organizations to:
1. Embrace accreditation as the way you do business, not as an extra initiative to take on.
2. Embrace strategic planning. Find the right strategic planning process for you, and closely link accreditation with your strategic plan.
3. Communicate and engage your board of directors with COA. Many parallels may exist in their industries (e.g., Six Sigma, ISO 9001, Joint Commission, etc.).
Thank you, Lad Lake!
We would like to thank Dan for his thoughtful insights into the accreditation process and acknowledge the entire board and team for embracing accreditation and collectively contributing to the continued success of Lad Lake.
Do you have an accreditation story to tell?
Click here to tell us about it.
You could be the next organization we feature!
It is no secret that the Council on Accreditation (COA) believes in what we do. We promote best practices and help our organizations to implement them with the aim that clients across the social services field will get the best possible quality of care. By accrediting the entire organization, we ensure that everyone—from human resources to finances to support staff—is working together to carry out that mission.

This is the “why” of organizational accreditation for COA and our accreditees alike. We are all here to do good; following best practices helps us do good in the most effective way possible.
Improving service quality is the most important benefit of organizational accreditation. But from our experience, it is not the only benefit! Every time an organization completes the accreditation process, COA asks about its impact. Several themes have come out of our survey responses.
Organizational accreditation improves operations.
Whole-organization accreditation provides a framework for staff to look at how they fulfill their mission now and discover how they can do so better. The benefits along the way are multifold: more open communication, sound strategic plans, streamlined work systems, better risk management…the list goes on. When an organization looks at itself holistically, it can find the root of any problems and be better equipped to solve them.
!["We have really enjoyed the fact that we are united by the power [of] COA accreditation and by sharing our common mission [of] providing children and families, in a contexual and in a multicultural approach, with the best." -Jorge Alberto Acosta, Founder of Nuevo Amanecer Latino Children's Services](https://static1.squarespace.com/static/5817757515d5dbcebad2b0bc/t/5c758d43f9619ac702a6edb4/1551207752285/Copy+of+Benefits+of+Accreditation+Pull+Quotes+%285%29.png?format=1000w)
94% of COA-accredited organizations agree that accreditation improves organizational learning and knowledge. 82% agree that it improves organizational capacity. COA accreditation has helped some organizations bring themselves back from the brink of bankruptcy; others have used it as a tool to position themselves to become leaders in the field.
Many have expressed that reaccreditation is not an end of itself, but a tool to help them achieve new heights of living their mission. COA is proud to help them do that.
Organizational accreditation boosts marketability.
Organizational accreditation is a professional, 3rd-party recognition that an organization meets the highest standard for both quality service delivery and administrative practices. The effort that an organization goes through to achieve accreditation proves just how much its staff cares about what they do.
This hard work helps organizations stand out among competitors and builds goodwill. 85% of our organizations agree that COA accreditation improves their organization’s marketability. 90% agree that it improves their relationship with external stakeholders. Clients and community alike are looking for signs of quality—accreditation gives them a big one.
Organizational accreditation helps secure funding.
Organizational accreditation verifies that an organization not only does quality work, but also has sound financial, administrative, operational, and oversight practices. This third-party verification can inspire the confidence funders need to support an organization as it continues to grow.
This can help in terms of government funding, as well. COA is recognized in over 300 instances in 50 U.S. states, the District of Columbia, Canada, and China. Our list of recognitions continues to grow, and with it the financial benefit to our accredited organizations. As of December 2018, 70% of our organizations agree that COA accreditation ensures funding.
Organizational accreditation can give staff a sense of fulfillment.
Accreditation encourages organizations to look at themselves frankly and work toward continuous quality improvement. This can allow staff to take a break from their daily grind and appreciate the big picture of their impact. Organizational accreditation also facilitates transparency and open communication, which can increase trust and the feeling that everyone is working as part of one team. Finally, the quest for quality improvement provides staff with new professional opportunities, allowing them to lead the charge toward a brighter future for those they serve.
Almost three quarters of COA-accredited organizations agree that accreditation improves workforce engagement, and over half agree that it improves staff retention. Many of our organizations describe how empowering it is to see the change in mindset that accreditation can bring.
Organizational accreditation holds the team to its goals.
As anyone with a broken New Year’s resolution knows, it is easy to put great plans in place and never carry them out. Accreditation (and reaccreditation!) forces organizations to follow through with those great plans, holding them accountable to be the best they can be.
94% of COA-accredited organizations agree that our whole-organization accreditation improves transparency and accountability. Through it, staff become not only accountable to their clients and stakeholders, but to themselves.
Time and time again, accreditation has proved transformative for our organizations, supporting their mission and allowing them to provide clients with the quality service they deserve. COA is grateful and humbled to be a part of this important process.
Have you experienced other accreditation benefits not listed here? Share them with us in the comments!
SOURCE: All statistics are pulled from 2018 survey data from organizations accredited by the Council on Accreditation (COA).
Accreditation is a journey. One with a clear destination, but a less defined path. There are mile markers along the way; however, there isn’t necessarily one straight, easy road to the finish line. Is there a recommended route? Are there any anticipated hurdles? If you are tasked with leading the accreditation process for your organization, you may not know where to start. This is where COA’s Accreditation Coordinators come in.

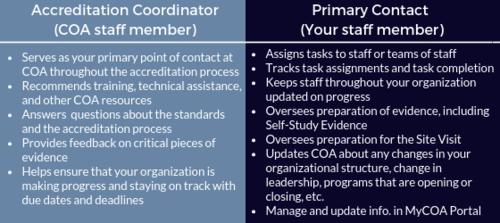
Every organization seeking COA accreditation is assigned an Accreditation Coordinator, a COA staff member that serves as a single point-of-contact throughout the accreditation journey. The role of the Accreditation Coordinator is unique to COA’s facilitative accreditation process. They work closely with the organization’s designated single point-of-contact, which COA refers to as the Primary Contact. Through this partnership, an organization obtains the support they need to navigate the road ahead.
Roles and responsibilities
Accreditation Coordinator
An Accreditation Coordinator works concurrently with a number of organizations. Their caseload can vary as well as the needs of each organization. The coordinators can also specialize in distinct accreditation programs or service types (Financial Education and Counseling, Employee Assistance Programs, Opioid Treatment Providers, etc.). Communication is a key element to this role. They’re responsible for answering questions, providing feedback on submitted documentation, and referring organizations to training and resources. Whether it’s to discuss specific documentation, standards, practices, or policies, they’re available on a daily basis to address inquiries from organizations. And because each organization comes with unique questions and circumstances, researching program models and administrative practices is also part of the work.

While the day-to-day routine of an Accreditation Coordinator involves providing tailored support to organizations, it is also valuable to note the role’s limitations. Accreditation Coordinators are not consultants and do not provide consultation to organizations. They can help Primary Contacts interpret the standards and answer questions, but are unable to dictate how implementation will look on the ground. Organizations are responsible for the application of the standards. And while they review and provide feedback on select pieces of evidence, specifically six key documents referred to as the Preliminary Self-Study (PSS), it is not within their role to review the entire Self-Study (aka all of the evidence that is required based on the assigned standards). The Site Review Team assesses the Self-Study prior to the Site Visit and will provide the ratings after conducting the on-site review.
Primary Contact
The Primary Contact is COA’s champion at the organization level and is in charge of spearheading the accreditation process. In this role, they’re responsible for engaging organization staff in all things COA. While the Primary Contact is the single point-of-contact, accreditation is by no means a one-person job. Accreditation is a huge team effort, from pulling together Self-Study evidence to preparing for the Site Visit, and the Primary Contact is the team captain. It’s no coincidence that we have repeatedly heard the role compared to “herding cats”!
Exploring the relationship between the Accreditation Coordinator and the Primary Contact
COA’s mission is to partner with human service organizations worldwide to improve service delivery outcomes by developing, applying, and promoting accreditation standards. The relationship between the Accreditation Coordinator and the Primary Contact brings that partnership to life. The two work together throughout the accreditation process, from start (the intake call) to finish (the notification of accreditation). They’re there to kick off the expedition, advise you of the twists and turns, help navigate roadblocks, and ultimately make sure your organization hits all the necessary milestones en route to the final destination. Along the way, Primary Contacts should provide the Accreditation Coordinator with updates on their progress, highlighting successes and challenges. That information helps COA gauge the organization’s strengths and needs and informs the provision of targeted supports.
Learning about the challenges of navigating the process is vital to COA. We want to know about the unexpected obstacles in order to assist with readjusting your approach and preventing you from spiraling off course. For example, Performance and Quality Improvement (PQI) can be one major hurdle for organizations. As the Primary Contact it can feel daunting to try to implement a culture of PQI, especially if your organization doesn’t have the framework in place. As an Accreditation Coordinator, some of my favorite moments working with Primary Contacts have come from discussing the evolution of PQI. It could be talking through the development of a PQI committee (“Who should be on it?” “How often should they meet?”) or figuring out performance and outcome measures (“Can you explain outputs and outcomes again?” “What are some examples of operations and management performance measures?”). Standards and technical assistance inevitability guide the conversation, but it’s through this exchange that we learn how an organization goes about creating change. And isn’t that what it’s really all about? PQI helps an organization become stronger to better serve their clients and community.
The relationship between the Accreditation Coordinator and Primary Contact is not one-size-fits-all. We are there to support in whatever capacity is most beneficial for the organization. For some this may take the form of structured monthly check-in calls, while others prefer Q&A exchanges over email. We recommend that organizations new to the accreditation process or new to the role of Primary Contact have more regular communication with their Accreditation Coordinator. Seasoned individuals may not need to rely on their coordinator as much; they remember the journey and have their path mapped out. Regardless of the frequency of contact, the door for communication is always open.
Tips for Primary Contacts
We know that serving as the Primary Contact is not an easy task. Often the work of accreditation is piled onto an already full plate. Here are some tips and tricks from COA’s team of Accreditation Coordinators:
- Use your Accreditation Coordinator as a resource. If you feel stumped or confused, don’t hesitate to reach out to your Accreditation Coordinator. Ask questions, it is what we are here for! That said, sometimes we get such excellent (and complex) questions that we need to consult with the team or the Standards Development department, which requires additional time. So it may take us time to get back to you with a response, but don’t worry; we will get back to you as soon as possible.
- Send us an email or schedule a call. The Accreditation Coordinator’s daily responsibilities are often collaborative – meeting frequently with organizations, our team, and other COA colleagues – which can sometimes impact our availability. We know Primary Contacts have busy schedules too. No one enjoys playing phone tag, it is best to schedule a call or send us an email. Our typical response time is 24 to 48 hours.
- Become friends with the MyCOA portal. We recommend that all Primary Contacts (and staff working actively on the process) participate in one of the regularly scheduled Intake Webinars in order to review all of the portal’s features and functionality. We don’t want to brag, but it is pretty cool! We encourage you to get familiar with the portal since this is where you will be completing the majority of the work. Check out the Step Pages, search for tools, and click all the buttons! Well not all the buttons.
- Attend a COA face-to-face training. There is no better way to familiarize yourself with all aspects of COA than attending either the in-person 2-day Intensive Accreditation Training or 1-day Performance and Quality Improvement Training. These in-person trainings provide Primary Contacts with an opportunity to learn from COA subject matter experts, meet COA staff and network with other organizations. We recognize this might not be a feasible option for all organizations due to limited resources and capacity. Therefore, we also offer a variety of complimentary live webinars and self-paced trainings covering similar curriculum. You can learn more and register through the Training Calendar.
- Don’t panic! This might be the most important tip on this entire list! The accreditation process is meant to be rigorous, but achievable. The goal is that you end the journey stronger than when you started. Change doesn’t happen overnight and it isn’t always easy, however, it is possible. The best advice for Primary Contacts is to not get overwhelmed; take the process one step at a time. Creating a work plan and communicating expectations to your team (don’t forget to enlist their help) is a good place to start. Have fun with it too! We have seen many primary contacts tap into their creative sides to invent games or enjoyable activities to get their team on board the COA train.
Training and resources
Want to know how to create a policy? We have a tip sheet for that! Want to know how to develop a strategic plan? We have a template (along with a self-paced training and blog post) for that! We’ve included just a few of the many resources that can help organizations on the road to achieving COA accreditation. We recommend exploring the full breadth of resources by accessing the tool search in the MyCOA Portal.
- Accreditation Learning Plan
- Getting Organized: Creating an Accreditation Workplan
- Preliminary Self-Study Fact Sheet
- Three-Part PQI Recorded Webinar Series
- PQI Tool Kit
- Preparing for the Site Visit
You are not alone
Many of us at COA have a social work (or social work adjacent) background, and the work we do to support Primary Contacts in their efforts to create change in their organizations, mirrors the work organizations do with their clients. We conduct an assessment. We create a service plan. We deliver supports and linkages to necessary resources. The makeup of our caseloads may be different, but we are all working towards a common goal – positive client outcomes and high quality services.
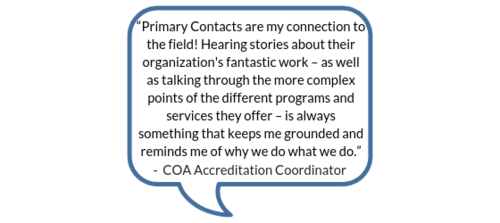
And as you learn from us, we learn from you. You are the change makers, advocating for those that you serve and making an impact on your communities. For many of us, the stories that you share and the work that you do are why we walk through the doors at COA. You are our direct connection to the field. Our collaboration allows us to gain a better understanding of service delivery and program models, as well as how the implementation of best practice looks on the ground for organizations of all shapes and sizes.
At the end of the day, an organization is ultimately responsible for their accreditation process, however, you are not alone on the journey. COA’s Accreditation Coordinators are there to support you and your team.
It is comforting to believe we know ourselves, our community, the universe, and our place in it. How else could we get out of bed every morning? That said, we must admit that much of our knowledge is inherited or built on an imperfect (and sometimes dangerous) foundation of experience and a priori reasoning.
a priori (a pri-o-ri): relating to or denoting reasoning or knowledge that proceeds from theoretical deduction rather than from observation or experience.
This is what excites me about data. Can we call it salvation? When collected and analyzed properly, data removes our subjectivity and can offer a neutral, reliable view of the world – if only a miniscule slice of it. Data is the heart of COA’s performance and quality improvement standards, and drives human service providers to continually monitor performance and investigate flagging or abnormal measures. Being deep in the data revolution, we now have unprecedented access to data about the world outside of ourselves and our organizations – critical for human service providers who have a special mandate to know and respond to the communities they serve.
The following are some of my favorite sources of public data relevant to human service providers. May you find refuge and transformation within them!
Data USA
The U.S. government collects lots of data. Lots of it. And most of it is publicly available – though likely raw, disorganized, and inaccessible to anyone without the skills to process it. Data USA connects to these sources of government data and makes them consumable by all:
- Natural-language generation translates data into plain, simple statements; each page feels authored by a human hand.
- Beautiful visualizations show trends over time or communicate complex datasets.
There’s a whole lot here, too: data on universities, colleges, and education opportunities; demographic data on cities, counties, ZIP codes, and states; job and employment data; medical and healthcare data; and more. Enter in your city’s name and see what happens. But Data USA does something remarkable by using its data to create local, state, or national benchmarks. For example, its natural-language generation algorithm produces this statement about Polish speakers in Chicago, IL:
When compared to other census places, Chicago, IL has a relatively high number of residents that are native Polish speakers. In 2015, there were 49,464 native Polish speakers living in Chicago, IL, approximately 9.4 times more than would be expected based on the language’s frequency in the U.S. more broadly.
Honestly, there is so much here. I recommend setting aside 30 minutes to deeply explore this unbelievable service.
How can human service providers use this data?
Research the demographic profile of your city, state, or ZIP code to ensure your client engagement practices are culturally nuanced. Are your materials translated into all local languages? Is there an area of the city more likely occupied by your target clients and so more deserving of time and resources?
Compare your client demographic data to the demographics of your service area. Is it possible that one or more groups are missing out on your services?
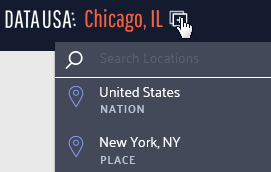
Use the compare function to analyze the differences between your service communities; to compare locations, click the icon shown below and select another location for comparison.
Individuals seeking services have often been fighting a long, lonely battle. Bolster your intake process by sharing relevant community data with service recipients to contextualize and destigmatize their experience. For example, a substance use treatment program could use the Excessive Drinking Prevalence measure found in the Risky/Harmful Behaviors section when serving individuals struggling with alcohol dependency.
Learn about basic measures of health and safety such as insurance coverage, medicare enrollment, and prevalent health conditions via the Health & Safety section of each location page.
Discover broader economic trends like this chloropleth on the poverty rate by county across the nation.
Nonprofit Finance Fund’s State of the Sector Survey
Since 2009, the Nonprofit Finance Fund (NFF) has run the State of the Sector survey to engage nonprofit organizations across the nation about their financial security and beyond: challenges facing their organization and their clients, opportunities they see in the next year, their use of program metrics and outcomes data, and more.
The 2018 survey results were affirming and surprising in equal measure. I’m not surprised that offering competitive pay is a top challenge reported by respondents, but that 67% felt the U.S. government made their clients’ lives harder? That’s shocking.
Want more? Tiffany Langston, Associate Director of Knowledge & Communications at NFF, provided a wonderful synopsis of the report, its function, and their findings in Data for Change: Nonprofit Leaders Raise Their Voices about the State of the Sector.
How can human service providers use this data?
Benchmarks are woefully scarce in the nonprofit/human service sector. Compare your organization’s performance to other nonprofits using many of the financial health measures found throughout the report. And, use the filters at the top to narrow the results to organizations like yours.
Start a conversation by reviewing the survey data with your team as either an element of your annual/strategic planning or simply as a team building exercise. Pause and reflect on each relevant question: what is the state of your organization and how could this impact your ability to deliver quality services? Do the findings reflect your neck of the woods? Why or why not?
Have an honest conversation about your organization’s theory of change, logic model, or outputs and outcomes measures. Are you, like 41% of respondents, operating without a theory of change or logic model? Do you, like 21% of respondents, not collect outcomes measures? How will this impact your ability to win grants in the future?
Leverage this data in conversations with policy makers and funders. Does your organization, like 60% of relevant respondents, receive late payments from your state? How does this inhibit or complicate your operations?
United States Census Bureau
The majority of the data output from the Census Bureau is aimed at researchers and other government entities and often not presented in an easily-consumable form. I recommend joining the Census Bureau’s mailing list for regular updates on gems like The Opportunity Atlas. This interactive map shows “the average outcomes (e.g., earnings) of children who grew up in each neighborhood in America, by demographic subgroup (race, gender, and parental income).”
Their Infographics & Visualizations page also has several interesting offers.
How can human service providers use this data?
Basic data on the communities served by human service organizations often reaffirm what front-line staff already know. But, being able to communicate these characteristics using hard data from respected institutions like the Census Bureau can bolster grant proposals, marketing collateral, and appeals to donors.
Forms 990 Data
How could we not talk about that shining ray of transparency, the Form 990? Let’s go beyond GuideStar and look at some fascinating services utilizing and transforming this data into information.
Citizen Audit
Citizen Audit makes the Form 990 look good. Traditional Form 990 data is accessible within a modern search interface and without learning what each schedule means (that’s 2 hours of my life I’ll never get back).
open990
Another beautiful interface for exploring Form 990 data. The layout is a bit simpler than Citizen Audit and shows a year by year comparison of all relevant data points by default.
ProPublica’s Nonprofit Explorer
Though less feature-rich than the services above, ProPublica’s Nonprofit Explorer provides quick and easy access to the text or raw XML versions of an organization’s Form 990 – great if you’re hunting for something in particular and want to execute a single page find across all data.
IRS Master Business File
For you pros out there, the IRS provides a download of all tax-exempt entities. These worksheets, divided into geographic regions (you can also download state-specific versions), contains the most recent Form 990 data on all tax-exempt entities.
How can human service providers use this data?
Benchmarks, benchmarks, benchmarks. Surely you are benchmarking your organization’s financial health against your past performance, but what about your peers? Dig up data on local organizations providing similar services and see how you compare.
Ask questions like:
- How are our financial ratios compared to our competitors?
- How does our CEO’s wage compare to other nonprofits like ours?
- We have 35 board members. Is that normal?
Find other organizations across the country providing similar services (for benchmarking or collaboration) using the NTEE code. The IRS categorizes all tax-exempt entities using this code; it’s a three character code where the first character, a letter, indicates the broad service area while 2 following digits reflect a narrower categorization of services. Find your NTEE code (most human service organizations have a P or F as the leading character), then find others with that same code and a similar revenue size. Use the resources above to dig into their 990 data.
Learn the ins and outs of your own organization – the 990 is typically comprehensive and is always a rewarding read. You might be surprised about what you discover!
Have you utilized any helpful data resources? If so, feel free to share them with us in the comments section!
These recommendations herein are those of the author; they do not constitute a formal endorsement by the Council on Accreditation.
When the Family First Prevention Services Act (H.R.253) was passed, it recognized that the best placement for children is in the least restrictive setting. This is also true for undocumented children in the custody of the Office of Refugee Resettlement (ORR).
In that regard, since 1997, the Flores Settlement Agreement has defined the rights of these children. In essence, it obligates the government to keep the children in the least restrictive setting and sets standards for their care. Recently, however, the Departments of Homeland Security (DHS) and Health and Human Services (HHS) have put forth a proposal to withdraw the agreement.
The agreement was never meant to be a de facto law so much as a framework, and in the original agreement there was a sunset clause expiring the agreement after 5 years provided the government implemented the terms of the settlement as federal regulation or Congress superseded it. Neither has happened. In fact, in 2015 the settlement was expanded to include all minors who come across the border without legal authorization (not just the unaccompanied ones who become custody of the federal government).
Despite the absence of the required federal regulation or congressional action, DHS and HHS have begun the process to withdraw the agreement. In doing so, families could be detained and placed in less regulated facilities, broadening the allowances for emergency loopholes for not meeting standards of care, and making it easier for government to revoke legal protections for unaccompanied minors.
This proposed rule change includes a comment period that ends November 6th, 2018 after which Judge Dolly Gee will determine whether the regulations are eligible to supersede the Flores Settlement Agreement. COA is urging interested parties to provide comments which put forth recommendations that emphasize the well-being of a child, and which ensure that migrant children receive trauma-informed and evidence-based care in the least restrictive setting.
The best practice of care for these children was established by the Flores Settlement Agreement and is contained in COA’s UC standards. It includes wraparound services to support their integration into society and placing them with kin or resource families in the most home-like settings. It has been two decades since the Adverse Childhood Experience (ACE) Study was conducted and the lessons learned have been indelible to the field: childhood trauma has long lasting effects. We cannot discuss the needs of this population without discussing the need for trauma-informed care.
So what can we do as human service professionals? Well, there are a few options:
- COA has put forth standards we consider best care for unaccompanied children. These standards are available our website. All comments and feedback will help shape the voice we provide DHS and HHS.
- Share your comments about what is best for children. Go to the Regulations.gov website for instructions on how to comment. Need some help with this? Here’s a resource to help you craft your response.
- Reach out to your representatives and ask what their plan is for the comment period and how they are defining proper care for unaccompanied minor children.
Thank you to Avi Rudnick, JD, MSW of Chicago House for this guest post!
In the early years of the HIV/AIDS epidemic in the U.S., nearly 100 activists met at the historic Baton Show Lounge to address the dire need for housing for Chicagoans living with AIDS; out of this Chicago House and Social Service Agency was borne as a not-for-profit providing a compassionate response to the disease. Chicago House serves individuals and families who are disenfranchised by HIV/AIDS, LGBTQ marginalization, poverty, homelessness, and/or gender nonconformity. Most of the individuals served have received messages in the past from family and friends that increase shame and stigma regarding behaviors and health status, which can result in a disengagement from services. It was important for Chicago House to choose a service philosophy that helped meet the service recipient where they’re at. Enter harm reduction.
What is harm reduction?

Harm reduction is a client-centered, trauma-informed approach that emphasizes safety and client self-determination. The philosophy dates back to work being done by activists, doctors, programs, and policy-makers in the 1960s and 70s as legal systems all over the globe began to take punitive measures against drugs. An early adopter of the philosophy was the Netherlands who put together commissions assessing whether strict law enforcement was best practice, referring to it as a “balance of harms.” It wasn’t until the 1980s that the collective efforts began to be referred to as harm reduction.
Harm reduction treats the individual as the expert in their own life, service recipients are given the agency to determine whether or how they want to change behavior. While harm reduction does not promote risky behavior, it also does not mandate sobriety as a barometer of success. A concrete example of how this plays out in the real world would be needle exchange programs. Needle exchange programs provide a safe, non-judgmental space for intravenous drug users to exchange their used needles for clean ones. They have been shown to significantly reduce the spread of blood-borne pathogens, such as hepatitis and HIV and, in fact, are associated with increased participation in treatment programs. Instead of focusing energy on the individuals’ sobriety, the programs provide resources to prevent the spread of disease and create a safe space for users. In addition to utilizing harm reduction approaches for addressing substance use, harm reduction is a philosophy that can be applied to many aspects of individual and community life, including, but not limited to: housing, health care, intimate partner violence, and mental health.
Why this philosophy works for Chicago House
Given the individuals served by Chicago House’s marginalized identities, it is not infrequent that one of the earliest and first hurtles is simply earning their trust and building rapport, that is Chicago House’s service providers’ first task. By prioritizing that relationship and putting the individual as the expert in their own life, the service providers help to even out the natural power dynamic that occurs and puts the individual at ease. Together the client and service provider can then explore the individual’s reasons for engaging in high risk behaviors and develop strategies and motivation to engage in safer behaviors (such as engaging in primary care and going on Pre-Exposure Prophylaxis). They inventory the individual’s coping mechanisms and enhance them. Harm reduction supports any positive change, thus putting the individual at ease that they are in a safe space.
Another reason harm reduction makes for a strong service philosophy for the population Chicago House serves is its relationship with trauma-informed care. Most of the clients served by Chicago House and Social Service Agency have experienced some form of trauma in their lives, so it is both fitting and necessary that the agency’s philosophy of care includes a trauma-informed approach to services. Client behavior is considered through the lens of someone who has experienced trauma and is honored as a coping and survival skill, highlighting the clients’ resiliency and ability to adapt which dovetails nicely with harm reduction’s strengths-based approach. Staff members work with clients to establish and maintain a sense of safety and mastery in their environment, something that is often times difficult for individuals with a trauma history, and recognize this as a basic building block for all other interventions.
Implementing harm reduction during service planning
Harm reduction philosophies are infused in the service planning process with clients and work to establish realistic goals regarding housing, health care, income, employment, education, substance use, mental health, etc. Chicago House approaches the creation of service plans with clients as a collaborative process, centering the client as the expert of their own life. While our funders may require that we include certain categories in our service plans, we work with clients on an ongoing basis to develop objectives and strategies to accomplish their goals. For some clients, a goal may be scheduling and attending an appointment with their HIV provider within the next six months, studying for the math portion of the GED exam, or going to the public aid office to apply for the Supplemental Nutrition Assistance Program.
Utilizing a collaborative harm reduction approach allows for changes in life circumstances and for our clients to move through the stages of change without being on the receiving end of shame inducing program requirements that increase fear and the possibility of discharge from programming. If a client does not achieve their goal within the six months outlined in the service plan, case managers use the opportunity to try different interventions, assisting the client in identifying strengths and new possibilities for different goals or a different approach to achieving the existing goal.
Harm reduction-related professional development
Chicago House regularly provides staff with professional development opportunities, such as brown bag lunches. One topic they facilitated recently was Sex Work: Reducing Stigma and Shame. Many of Chicago House’s clients have or are currently engaged in sex work. Instead of asking them to stop or making them feel bad about their choices, providers are being taught about the experience of sex workers so that they are more equipped to support the service recipients.
During this brown bag, staff watched a video of a Ted Talk presented by Juno Mac. She is a sex work activist who fights for sex worker rights and decriminalization of sex work. The discussion was centered on the implications of sex work for specific communities, particularly for trans women of color. Staff reviewed the report, Minority Stress and Sex Work-Understanding Stress and Internalized Stigma by the Sex Workers outreach Program (SWOP) as well as the National Transgender Discrimination Survey, Meaningful Work: Transgender Experiences in the Sex Trade. The brown bag talk wrapped up by reviewing the SWOP guide, Screening 101: Introductory Advice on Why Screening is Important and Some Basic Tips for Avoiding Bad Dates. This screening tool is information that can be directly relayed to the individuals served, providing strategies for reducing harm when engaging in sex work.
Additionally, all new staff members at Chicago House participate in a six-month philosophies of care training series, that includes an in-depth curriculum on harm reduction approaches, with two of the six sessions dedicated to trauma-informed care and motivational interviewing. All program staff members begin this training program within the first three months of employment for a total 12 hours of training on harm reduction approaches.
How other organizations can integrate harm reduction
- Develop and implement ongoing trainings for program staff and administration on harm reduction and related philosophies, such as trauma-informed care and strengths-based approaches.
- Infuse harm reduction language in all policies and procedures, reassessments, service plans, and psychosocial assessments, ensuring to eliminate language that can increase shame and stigma (i.e. not using the terms “clean” and “dirty” when referring to substance use).
- Eliminate the possibility of discharge or ineligibility based upon substance use, sex work, and/or criminal background by focusing on behavior and not stigmatized labels and identities.
The views, information and opinions expressed herein are those of the author; they do not necessarily reflect those of the Council on Accreditation (COA). COA invites guest authors to contribute to the COA blog due to COA’s confidence in their knowledge on the subject matter and their expertise in their chosen field.

Avi Rudnick
Avi Rudnick, JD, MSW began his time at Chicago House and Social Service Agency as a supportive housing case manager in July 2013. Avi stepped into the role of Director of Scattered-Site Housing in February 2016. Avi also facilitates trainings for program staff on harm reduction, trauma informed-care and motivational interviewing. In addition to his role at Chicago House, Avi has been the coordinator of the monthly Name Change Mobilization at the Transformative Justice Law Project of Illinois since 2012. Prior to working at Chicago House and his involvement with TJLP Avi worked as a public defender in Portland, Oregon.
A big thank you to Tristan Keelan of TenEleven Group for this guest post!
The Behavioral Health field is undergoing a data revolution where electronic capture of daily activity is expected to produce reports that demonstrate, among other things, quality. The initial response to this paradigm shift is to have an electronic health record that can capture data, and produce reporting and analytics capabilities that use the data to demonstrate agency effectiveness. While front-end data capture and back-end information reporting are certainly critical elements of the value based care equation, there is still an element of intervention required by your Quality and Compliance staff to ensure that your data has integrity. To achieve data integrity, you need to make sure that you’re collecting your data in a repeatable manner that provides consistent and accurate data.
Find your outcomes measurement tool
One of the best ways to demonstrate value in behavioral health is to adopt standardized outcomes measurement tools. Tools like the CANS/ANSA, PHQ-9, DLA-20, GAD-7, Columbia Suicide Risk Scale, and many others are designed to allow for the measurement of client populations to be viewed in aggregate for the purposes of demonstrating agency effectiveness. However, the integrity of the outcomes data you capture is going to be critical for framing the story telling that is done once your results are in.
3 tips for maintaining outcomes integrity
The three critical elements that you can manipulate to drive data integrity within your outcomes tools all revolve around creating and enforcing repeatable processes. When your processes are repeatable, you can present your reports with foundational context that improves your presentation. This can turn “here are our numbers,” into “We follow these processes and procedures, which we know drive success, and the proof is here in our numbers.” And the second version is much more convincing.
These three elements are:
1. Determine the cadence that outcomes measures will be captured by, and enforce it.
You want to use standardized outcomes measurement tools so that you can find a way to commonly measure success across your patient population as the progress through treatment over time. Normally when we measure patient outcomes over time, we would make the date the tool was administered the X-axis that would drive our visual; however, in the case of behavioral health outcomes measurement at the agency level we cannot do that.
If you were to look at outcomes scores by date, you end up with a mash up of scattered data because clients are not all seen on the same days. For a visual example, look to the PHQ-9 outcomes scores shown in the graph below:

To rectify this and bring your clients into an “apples to apples” view of progress, you must group the scores into the iteration of the form that was administered – first time, second time, third time, etc. When you do that, you bring a focus to what your outcomes look like at the agency level.
The image below shows the same data set, for the same time period, but it is organized with “Administration Number,” as the X-axis to bring the average improvements of client across the agency into focus.

To make this data tell the story you want, you must be able to articulate what your process for capturing the outcomes measurement is. For example, the measure could be administered every time the customer is seen. Or, every 3rd visit. Or, every 3 months (maybe this coincides with treatment plan reviews). Whatever your agency’s choice is, it should be agreed upon, and enforced. From a quality enforcement standpoint, there should be monitoring reports and procedures to follow-up with therapists who have clients fall out of the agency defined outcomes measurement procedures.
Those monitoring reports can also be run historically to determine how often your process is falling outside the desired timeframes, and thus how far off your data integrity is from the desired. If your monitoring reports show that your clinicians are administering the PHQ-9 at different points in treatment for each client, you will have a low data integrity.
Your agency should strive to be able to speak to outcomes in terms of the example phrase, “the positive trend in PHQ-9 scores reflects our process to administer the measurement tool within 14 days of the treatment planning due date, which we achieve 99% of the time.”
When your Behavioral Health agency can add these types of process statements in conjunction with positive trending outcomes reports, then your value proposition appears substantially stronger to your audience.
2. Acknowledge outcome drift – respect the anchors and keep them front and center
Your clinical staff wants their clients to improve; that’s why they got into this business in the first place. However, this presents a common problem for clinical staff who administer scoring tools. Because the desire is for the client to improve, the previous score can often replace the scoring anchors in the subconscious of the person doing the scoring.
For example, consider the following simplistic version of a hypothetical 3 point symptomatic scale.
In the past month, how often did you experience feelings of anxiety?

In our example, let’s assume the client has scored a 2 on the past two administrations of the tool. The therapist can begin to rationalize that while the client is exhibiting signs that reflect a 2 = Some of the Time, they seem to be doing better overall. Instead of marking a 2 for the third time in a row on this question, the therapist can begin to use the desire for improvement to justify marking a 1 = Very Little because of the appearance of overall improvement.
This type of “Anchor Drift” is natural and should not prevent the use of standardized outcomes tools, but rather should be protected against. There can be a tendency in EHR software systems to streamline forms in a way that removes unnecessary elements that may have existed in the original paper version. This is where it helps to combat that tendency to drift toward improvement by making the anchors present on the form every time it is completed.
In this case if our anchors, “Very Little,” “Some of the Time,” and “All of the Time” are right next to the questions, it will help to subconsciously override the client’s previous score as the anchor. Stripping out the anchors on an electronic form seems like an efficiency gain of space on the screen, but a smart EHR will keep outcomes anchors present on the form to hold the integrity of the tool above the well-meaning desire for clients to improve.
3. Periodically audit your outcome tool with self-assessments
In conjunction with the previous effort to maintain integrity to the outcomes anchors, you can enforce an audit of your clinical staff compared against your client population. Introduce the client to the outcomes anchors, and ask them and the therapist to each complete separate versions of the form at the same point in the treatment. Then you can measure the variance between them at the agency, therapist, and client levels.
As with all things discussed thus far, there are multiple ways to conduct this audit, and it’s really all about establishing and maintaining process. You can dictate that a self-assessment audit is performed every fourth administration of the outcomes tool. Or, call for random self-assessment auditing at different points and have the audit reflect a date in time, versus a static stage of the process that moves with time. Both methods demonstrate that the agency is committed to maintaining anchor integrity. If the anchor drift feels strong, the agency can move towards refresher training or other follow-up methods that are meant to always keep therapists scoring to the anchors.
Show off your good work
When presenting data, you want to be able to articulate the procedural steps that your agency is taking to ensure that showing a positive trend line can be taken as a representation of actual client improvement. This can make all the difference between winning a contract or being overlooked despite your good work.
The views, information and opinions expressed herein are those of the author; they do not necessarily reflect those of the Council on Accreditation (COA). COA invites guest authors to contribute to the COA blog due to COA’s confidence in their knowledge on the subject matter and their expertise in their chosen field.

Tristan Keelan
Tristan Keelan is the Marketing Strategist at TenEleven Group. Tristan holds a BA in English from Elmira College and an MBA from St. Bonaventure University. He uses his experiences working in Government, Non-profit National Service, and Banking to bring business process and analytics driven insights to the behavioral health industry.
You can read blog posts from Tristan here.
If someone were to rate their wellness level, their first instinct might be to measure their physical or mental health against common indicators, such as the presence of an illness or injury. These markers are a good place to start, but one’s health status does not happen in a vacuum independent of their environment.
As the United States continues to find its healthcare system under fire, one issue many point to is the health disparities mediated by race, ethnicity, geography, orientation, socioeconomic status, etc. Both level of education and socioeconomic status have direct correlations to health status, with individuals living in poverty eight times as likely to have poor health outcomes. As recently as April 2018, the New York Times reported on significantly high mortality rates for America’s Black mothers and babies in comparison to their white counterparts and how that relates to their lived experience.
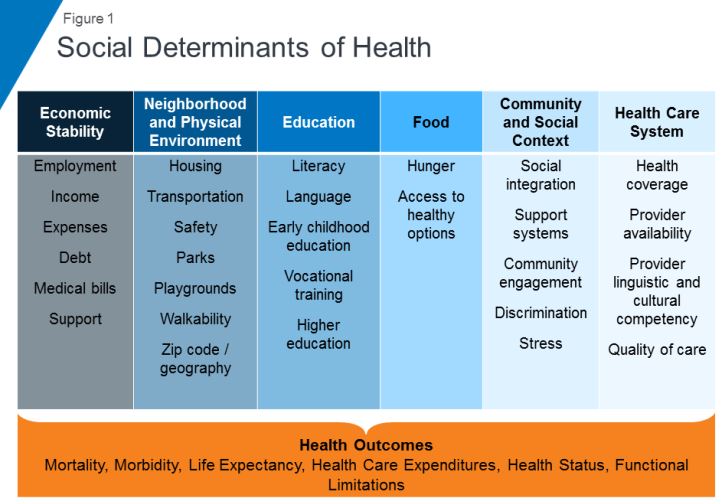
Often times your health is influenced by factors beyond the individual’s control, factors related to their social context. Health professionals refer to these as social determinants of health (SDOH) and they have become the focus of increasing interest when it comes to closing the health disparity gap and taking more proactive approaches to population health and well-being.
Defining SDOH
SDOH refer to economic and social conditions and their distribution among the population thus influencing individual and group differences in health status. They are factors found in one’s living and working environments rather than individual risk factors such as behavior or genetics, which can impact one’s vulnerability to disease.
The Center for Disease Control (CDC) and the World Health Organization (WHO) have both emphasized the importance of taking into consideration the conditions in which people live, learn, work, and play when assessing health status. WHO frames the potential for these experiences to be health-damaging as “the result of toxic combination of poor social policies, unfair economic arrangements, and bad politics,” calling for society to look beyond the health sector when dealing with issues of health and disease.
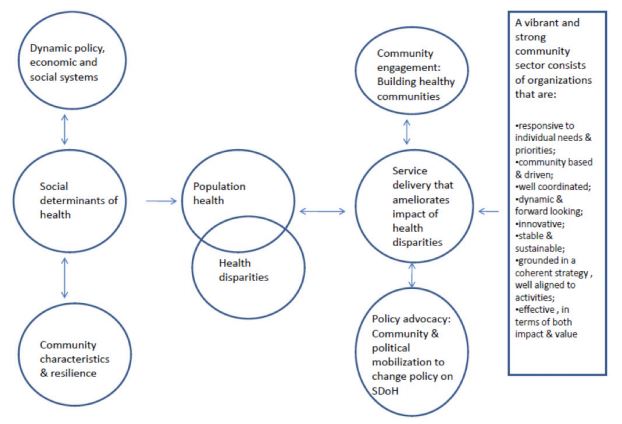
Audrey Danaher, from the Wellesley Institute, created a framework to describe how these social determinants may play upon each other given that the impact is not direct, but mediated. For instance, community characteristics and resilience can have an effect upon SDOH independent of policy, economic, and social systems. A responsive community sector (e.g. non-profit organizations that provide services within communities to meet needs) can help to reduce the disparities through engagement, advocacy, and service delivery. It is worth noting that Danaher’s data and framework comes from communities in Canada, which has universal, single-payer healthcare, further supporting the argument that individual health goes beyond just healthcare.
SDOH on individuals’ health
SDOH play a significant role in individuals’ health outcomes, and research has demonstrated that there is a social patterning of disease. Per Williams, Sternthal, and Wright (2009), “disadvantaged social status predicts higher levels of morbidity for a broad range of conditions in both children and adults.” Growing up in economic poverty in and of itself is correlated with a broad range of health-damaging conditions (e.g., family turmoil, neighborhood violence, consume polluted water and air) and growing up as part of a marginalized community increases your exposure to psychological stressors. But how do these things in turn play a role in individuals’ health?
Let’s look at asthma. While the consumption of polluted water and air increases the risk of asthma within the population, this alone does not fully account for this disparate distribution childhood asthma. In a 2017 study, researchers found that African-American children living in lower socioeconomic neighborhoods were 8.8% more likely to have asthma than their white counterparts, 6.7% more likely in middle-class neighborhoods, and 5.8% more likely in affluent communities. Not only are there differences among racial lines, but youth in more deprived communities are significantly more likely to have asthma emergency department visits and significantly more asthma inpatient admissions. Some SDOH identified as playing a role in these group differences include maternal stress during pregnancy, living in communities with higher levels of violence, overburdened or absent social supports, and psychological morbidity.
Another example of a SDOH is food insecurity, defined by the U.S. Department of Agriculture as a lack of access to enough food for an active, healthy life. Food insecurity is caused by a number of elements such as income and unemployment, disability, and food deserts, which are associated with both socioeconomic status and race/ethnicity. Food insecurity does not necessarily cause hunger, although it is a possible outcome, but it is tied to chronic disease such as hypertension, hyperlipidemia, and diabetes.
Community sector in action! Connecting SDOH to service delivery
Community sector initiatives have often taken the lead in responding to deprivation and negative SDOH. Due to the nebulous nature of SDOH and how they’re specific to different communities and populations, it makes sense that change comes from within the community itself. Just as communities can be a cause for poor SDOH, they can also be the catalyst for improving them and thus improving the community’s outcomes.
Majora Carter’s environmental justice work in the South Bronx is an excellent example of a community-driven response to SDOH. The South Bronx is home to a significant number of industrial plants, including waste processing (40% of the city’s waste and 100% of the Bronx’s end up there), sewage treatment, and four electrical power plants. It has the lowest ratio of parks to residents throughout the entire city; it ticks all the marks on social determinants of health listed above as well as the poor corresponding outcomes. Carter started with the goal of creating a new park, which subsequently led to a greenway movement. One of her next moves was to secure funding for a waterfront esplanade that allowed for a wider range of forms of transportation, thereby influencing policy on traffic safety in the area. Using social capital, she also created facilities that would not only bolster the health of residents in the community but improve quality of life (e.g., encourage residents to be more active) and create opportunities, such as green-collar jobs and community business investment. By recognizing and focusing on the impact of the environment on the health and safety of its inhabitants Carter was able to develop solutions to improve the health of her neighbors.
Carter’s success is not isolated. COA accredited organizations are the community sector and often occupy the spaces needed to rehabilitate SDOH. While this not has always been an explicit or even conscious goal of human and social service delivery, if you look at the SDOH listed in the graphic above, you can map the services provided by COA accredited organizations onto the list. Whether it’s providing youth with alternatives to out-of-school suspension, offering assistance with navigating the healthcare system, or providing housing and community resources in a supported living program, all of these solutions fill gaps in the community and boosts their SDOH.
Next steps
This wouldn’t be a COA blog post without a few ways in which you can get involved. Here are a few initiatives working to improve social determinants of health:
One of the most powerful actions you can take is to get involved with your own community. What are some of the issues you see around you? What are some of the areas that need further support? Are there grants from your city to help implement the changes needed? Chances are, there are already organizations working towards improving community health outcomes with opportunities to volunteer or partner.
Thank you to Tiffany Langston of the Nonprofit Finance Fund for this guest post!

History of the survey
In 2008, the economic downturn created an atmosphere of fear and uncertainty, not just for individuals, families, small businesses, and corporations, but it was also a very scary time for nonprofits and their clients. At Nonprofit Finance Fund (NFF), we wanted to find a way to tailor our financing and consulting services to be the most helpful to charitable organizations. How could we offer support, tools, and resources, so that nonprofits could navigate this tricky time? We decided to ask nonprofits how the changes in the economy affected their bottom line and the ability to serve their communities. The State of the Nonprofit Sector Survey was born.

Nonprofits are a linchpin in creating social good. Yet there is precious little collective, real-time data on how nonprofits are doing. Are they serving more clients or fewer? Do they have the resources they need to do their work? Are they opening new offices, or dangerously close to closing their doors?
We launched the first Survey in early 2009, with little fanfare and almost no promotion. We rolled up our sleeves, opened our rolodexes, and asked our networks to spend 15 minutes to tell us how they were feeling, what they were doing to combat the recession, and how NFF could help them deliver on their missions. We heard from 986 respondents, many of whom told us that they were feeling financially vulnerable, bracing for funding cuts across the board, preparing to end the year with a deficit, and developing a ‘worst-case scenario’ contingency plan. The recession brought into focus a serious, long-standing issue: the nonprofit sector is continually forced to do more with less, and the margin between stability and crisis is often precariously razor-thin.
But the thing that surprised us most was the numerous requests we got from media, researchers, policymakers, nonprofits, and funders, to do a deeper dive into the data. The results were published in The New York Times, CNN.com, and The Chronicle of Philanthropy. There was a thirst for real-time data, and at the time, no one else was doing this type of survey on a national scale.
Over the years, the questions adapted as the sector changed. It became a widely-watched barometer of US nonprofits’ programmatic, operational, and financial health. In 2010, we found that while the economy was recovering from the recession, nonprofits were not having the same success. By 2011, 87 percent of the 1,935 respondents said they still felt like the recession hadn’t ended. In 2012, we started asking about government grants and contracts, and if nonprofits were getting paid on time. The outlook finally started to improve by 2013, and we inquired about how organizations collected data and measured impact. And this year, we asked nonprofits about the diversity of their senior leadership and board members, and if their organizations proactively address racial inequity.
State of the nonprofit sector survey 2018
We are living in volatile times. As we prepared for the 2018 Survey, we were excited to get the pulse of the US nonprofit sector and better understand the challenges organizations now face. The 2018 State of the Nonprofit Sector Survey opened on January 16 and closed on February 28. We heard from 3,369 leaders across all 50 states and a wide range of sizes and missions. Respondents said they’re facing chronic challenges and real-time concerns, remain resilient and committed, but are worried about the vulnerable people they serve.
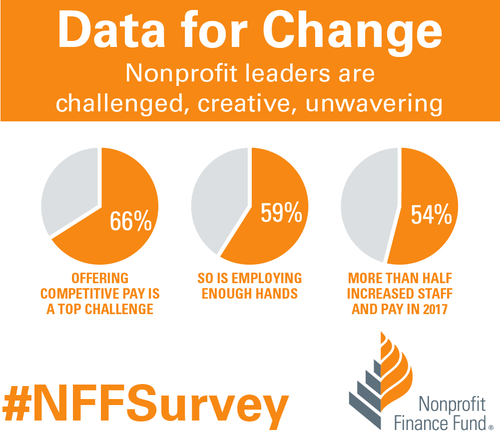
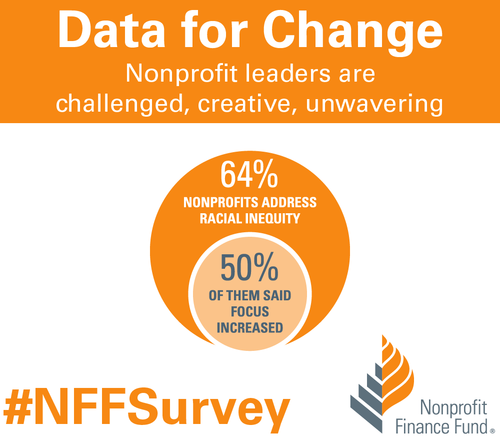
When asked about 2017, 79 percent of respondents saw an increase in demand for services, and 86 percent anticipate an increase in the coming year. Not only did 57 percent of nonprofits find it difficult to keep up with the rising demand last year, but that number swells to 65 percent for organizations serving low-income communities. Despite the challenges, nonprofits continue to invest in programs, staff, and strategies. We found that 52 percent of respondents said their organizations expanded services in 2017, and 63 percent plan to do so in 2018. We learned that 54 percent of responding nonprofits increased staff and 55 percent increased compensation in 2017. We found that 64 percent said they address racial inequity, and half of those said that focus grew in 2017. We also learned that 76 percent of responding nonprofits finished 2017 at break-even or better.
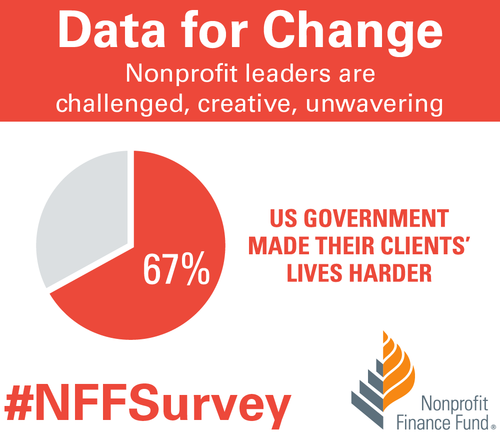
Affordable housing was the most-cited critical community need, followed by youth programs, mental and behavioral health services, and financial capability. We also asked nonprofit leaders how the federal government’s policies & positions influenced the communities they serve, and 67 percent said those practices make their clients’ lives more difficult. Additionally, 37 percent of respondents said their organizations plan to formally engage in policy/advocacy in 2018.

How to use the data
At NFF, our mission is to create a more just and vibrant society. One of the ways we work toward that is by sharing accessible insights, so that the sector has the necessary data to make informed decisions. You can explore the Survey results completely free of charge using our Analyzer. Compare your nonprofit to peer organizations across focus areas, sizes, and geographies. Use the findings to inform planning around strategy and budgeting. Cite data in your campaigns, white papers, testimonials, and grant proposals. Use the data as evidence to support open discussions with funders about the full costs of service delivery and meeting the needs of your communities.
We invite you to dig into the data. Use the filter or combination of filters that gives you the right slice of information for your presentation, board meeting, or application. You can even download images of the visualizations and drop them right into a slideshow or report. Please let us know how you’re using the findings to deliver on your mission. Email us, or share on social media using the hashtag #NFFSurvey. Thank you to everyone who took the State of the Nonprofit Sector Survey, entrusted NFF to raise your voices, and contributed to this critical social sector data set.
The views, information and opinions expressed herein are those of the author; they do not necessarily reflect those of the Council on Accreditation (COA). COA invites guest authors to contribute to the COA blog due to COA’s confidence in their knowledge on the subject matter and their expertise in their chosen field.

Tiffany Langston
Tiffany Langston is the Associate Director, Knowledge & Communications at Nonprofit Finance Fund. She has worked at the intersection of nonprofits and philanthropy for nearly a decade, including overseeing digital communication efforts for WaterAid America and Philanthropy New York, respectively. She is a food lover, writer, and her work has been nominated for a James Beard Foundation Journalism Award.
You are probably familiar with the ripple effect. The term refers to a sequence of events that is triggered by a particular incident or occurrence. The most common example is dropping an object into a body of water…let’s say a stone in a lake. Once it falls, the stone causes a series of waves that spreads across the body of water, the waves ever expanding their reach. The metaphor is often used to describe the potential impact that our actions have on others and the world around us. At times, we may not even be aware of the ripples that we set in motion.
There is no better way to describe the current opioid epidemic. Opioid dependence doesn’t just affect the individual user; it touches the lives of those around them, leaving its mark on children, family members, and friends. And it doesn’t end there. The ripples grow and extend to countless sectors.
One system that is feeling the impact of the opioid epidemic is child welfare. Reports from public officials, advocates, and those working in the field echo the same sentiment – the current crisis is overwhelming. As opioid abuse continues to increase nationwide, the demand for foster care placements is also on the rise. This leads us to wonder what is the relationship, and what does it mean for families and future generations of children?
In recognition of National Foster Care Month, this article will shed light on the connection between the opioid epidemic and child welfare and contribute to the ongoing dialogue on how policy and practice can better support those working with families entrenched in this devastating crisis.
The scope of the problem
Opioid use disorders and fatalities continue to rise
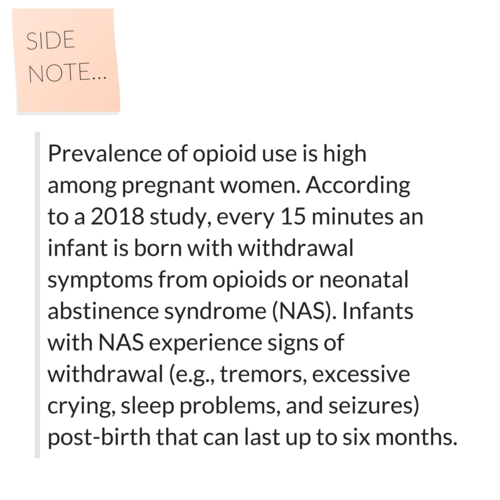
There has been a sharp uptick in the use of opioids since 2010. According to SAMHSA, in 2016, 2.1 million Americans had an opioid use disorder (OUD). As that number continues to rise, so does the number of fatalities. The Centers for Disease Control and Prevention (CDC) reports that 115 Americans die from an opioid overdose every day.
The number of children who have parents struggling with OUDs is unknown. However, a 2017 analysis yielded that 1 in 8 children resided with at least one parent who had a past year substance use disorder (SUD). The report also found that 1 in 35 children lived in a household with at least one parent who had an illicit drug use disorder. Unfortunately, it leads us to consider that parents are among those that we lose to the opioid crisis on a daily basis.
Foster care placements are increasing
Concurrently, as reports of opioid use rise, the demand for foster care placements across the country has also grown. The number of children entering foster care was on a steady decline for more than a decade; however, the tide shifted in 2012. From fiscal years (FY) 2012-16, the number of children in foster care nationally grew by 10%. While individual states varied, more than two-thirds experienced a surge in foster care caseloads during this period. Six states – Alaska, Georgia, Minnesota, Indiana, Montana and New Hampshire – saw foster care populations rise by more than 50%.
More children are residing with grandparents and relative caregivers
Another recent development is the growing number of grandparents taking on the primary caregiver role. Generations United reports that about 2.6 million children – 3.5% of all children nationwide – are being raised by grandparents or relatives across the country. When we look at the data, 32% of children in foster care are being raised by kin, more than previous years. And that may be just the tip of the iceberg. It is estimated that for every child in foster care with relative caregivers, there are 20 children being cared for by grandparents or other family members outside of the foster care system.
Parental substance abuse is a contributing factor for out-of-home placements
What contributes to the need for out-of-home placements? According to the latest national data, parental drug abuse is a factor in roughly one-third of all child removals. While the proportion of children entering foster care due to these circumstances appears to have remained steady over the past few years, it is increasing. Looking across the different categories for removal, drug abuse by a parent had the biggest percentage point growth between FY 2015 (32%) and FY 2016 (34%), which is notable in the face of the current epidemic.
Connecting the dots
So…is there a relationship between the opioid epidemic and child welfare, and if so, what is it? It’s complicated.
Given the timing of these trends, it is hard to imagine that increased opioid use doesn’t play some role in rising foster care caseloads. A recent national study found that counties with higher substance use indicators (drug overdose deaths and drug-related hospitalizations) have higher rates of foster care entry, indicating a relationship between child welfare caseloads and substance use prevalence. However, we have to remember that correlation does not automatically equal causation (proof that what you learn in statistics will come back around) since we can’t control for all demographic and socioeconomic factors and their potential influence on out-of-home placements.
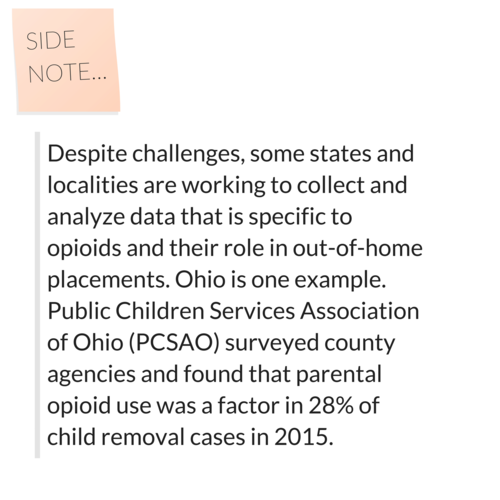
Even though the increase in foster care and relative care placements has been attributed to the opioid epidemic, empirical evidence to prove cause and effect is lacking. This is in part due to the way that the federal government and states track data on child removals, more specifically the contributing factors. For example, there is national-level data on the number of children being removed due in part to parental drug abuse, but it isn’t broken down in a way that shows what type of drug was being abused. Therefore, there is no way to know how many foster care placements stemmed from opioid abuse versus the abuse of another type of illicit drug.
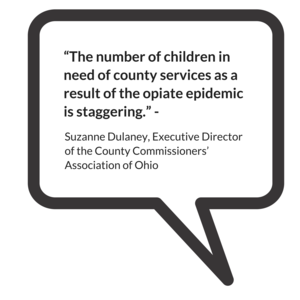
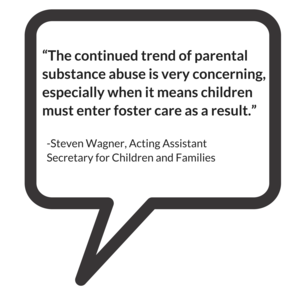
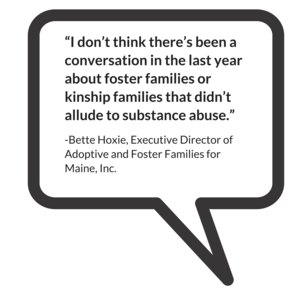
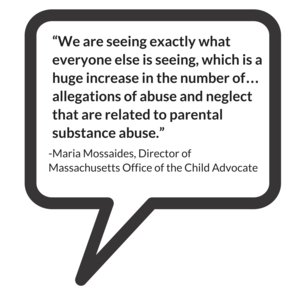
Nonetheless, public officials, advocates and others working in the field are making a direct link between the opioid crisis and increased demand for out-of-home placements. Anecdotally, there are similar accounts across states of the opioid epidemic and its impact on communities. Child welfare agencies are seeing more children come into care because of parental opioid abuse, and children entering the foster care system are getting younger and younger. It has been reported that there aren’t enough foster homes to meet the growing need. Caseworkers are feeling overwhelmed by growing, multifaceted caseloads.
What does this all mean for children and families?
Substance use disorders impact on families
Let’s take a step back. To understand the ripple effect of the opioid epidemic, we have to first look at how parental substance abuse impacts child and family outcomes. At a foundational level, parents struggling with a SUD may not be able to provide for a child’s basic needs (e.g., appropriate supervision or nutrition). Equally troubling, a child can be deprived of emotional support and positive attachment, critical factors in healthy childhood development. Inconsistent parenting inevitability hinders stability in the home. For a child, life can become chaotic and unpredictable, both of which are associated with negative outcomes. That is why parental substance abuse is a known risk factor for child welfare involvement. A 2016 study found that when compared with their peers, children whose parents faced SUD-related issues were three times more likely to experience abuse (physically, sexually, or emotionally) and four times more likely to experience neglect.
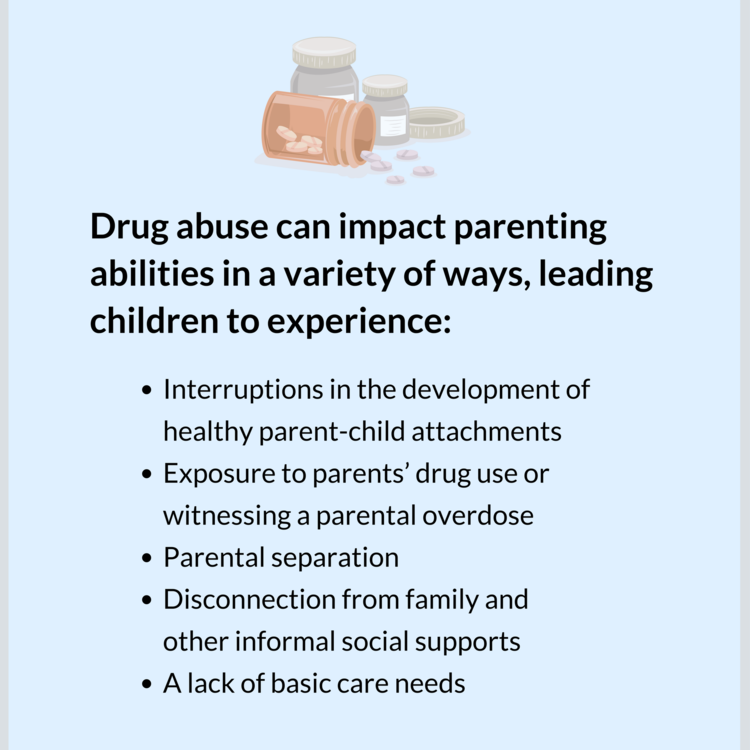
Parental substance abuse and child trauma
We know that trauma experienced early in life can adversely impact a child’s development and have long-term health consequences, and parental substance abuse is a one form of childhood trauma (aka an adverse childhood experience or ACE). Often, substance abuse is compounded with other types of adversity, making the severity of potential negative outcomes even worse.
Research shows that history has a way of repeating itself. Children who grow up with complex trauma are more likely to struggle with substance-related issues. One study found that individuals with five or more ACEs were seven to ten times more likely to have issues with illicit drug use. Other explorations into the topic have yielded similar results. There are a host of reasons why people with past trauma experience are more vulnerable to developing a dependence on substance use. While not all children will experience such consequences, the risks to future generations are far too great and warrant immediate intervention. In order to break the cycle, we have to find a way to address the opioid epidemic that is trauma-responsive.
The role of child welfare
The child welfare system is poised to be a catalyst for change. Agencies are tasked with protecting children from maltreatment, abuse, and neglect, and in-home services play a critical role. In-home services are aimed at promoting the well-being of children by ensuring safety, achieving permanency, and strengthening families. When faced with familial challenges, keeping children with their parents is optimal (as long as it is safe and appropriate). Children do best in families with the support of at least one caring adult. Even in crisis, children can thrive when the right protective factors are in place. Removing a child from his or her home disrupts daily life and expectations. All of that instability can be traumatic. The stress that stems from coping with parental loss can have long-lasting effects on a child’s emotional, behavioral, and academic outcomes.
Parental substance abuse has long been an issue for child welfare agencies, one that is now amplified by the recent opioid epidemic. Child welfare agencies across the country are inundated with high caseloads. The complexity of the cases given the unique circumstances and service needs of families battling opioid dependence are adding another layer to an already challenging situation. Not to mention, family stabilization and/or reunification is complicated (contender for understatement of the year). Despite what we know about keeping families together, having children remain with their parents may not be in their best interest due to the impact that substance abuse can have on parenting, making out-of-home placements the safest option. What’s more, reuniting children with their parents can be tricky given ebbs and flows of recovery. The tug-of-war that this creates for caseworkers can be challenging to navigate. So, how do we support those working with families experiencing the crisis firsthand?
Where do we go from here?
Implement what works for families
States and localities are getting creative and implementing interventions that have proven effective for families, recognizing the trauma associated with parental substance abuse. There is ample support for family-centered treatment for substance abuse, including opioid dependence. Additionally, program models that focus on systematic change and cross-system collaboration have also been linked with favorable outcomes.
- Sobriety Treatment and Recovery Teams (START) is an intensive, integrated program for families experiencing co-occurring substance use and child maltreatment. START launched in Cleveland, Ohio in 1997 and extended to Kentucky roughly a decade later. The program matches up specially trained child protective services workers with family mentors (peer support specialists in recovery), behavioral health treatment providers, and the courts. The goals of the program are to ensure child safety and reduce the need for out-of-home care. A 2012 study on the impact of START on family outcomes found that mothers who participated achieved sobriety at a higher rate than those in more traditional treatment programs. Children were also placed in the custody of the state at half the anticipated rate.
- Medication-assisted Treatment (MAT) – an approach that combines medication with counseling and behavioral therapies – is a best practice, and has been linked to decreases in negative outcomes (e.g., opioid use, opioid-related overdose deaths, criminal activity, and infectious disease transmission) and increases in social functioning and retention in treatment, two factors that play heavily into improved parenting skills. MAT has also been found to be effective in providing care for pregnant women who struggle with opioid dependence. Despite some misconceptions in field out the approach, MAT has been associated with improved prenatal care, reduced illicit drug use, and better neonatal outcomes.
- Family Treatment Drug Courts (FTDCs) are specialized courts that respond to cases of abuse and neglect involving caregiver substance misuse. Using a family-friendly approach, FTDCs combine judicial oversight and comprehensive services by bridging together substance use treatment, child welfare services, community supports, and the court system. The unique model balances the rights of both children and parents and aims to create safe family environments while treating the parents’ underlying substance use disorder. In 2015, there were a reported 300 FTDCs across the country, with models and implementation varying state-to-state. The benefits associated with FTDCs include higher participation rates and longer stays in treatment (when compared with non-FTDC participants). The model also yields positive child outcomes; children reportable spend less time in out of home care and are more likely to be reunified with their parent(s).
Support for child welfare agencies and caseworkers
Child welfare agencies are first responders to families in crisis. Caseworkers can encounter stressful or traumatic experiences working with families opioid dependence, witnessing the aftermath of a parental opioid overdose is just one devastating example. That is why supporting frontline staff is imperative.
Provide Specialized Training
Reports indicate that there can be gaps in knowledge among caseworkers around the needs of families with substance use issues and the treatment of opioid use disorders. Training and support in these areas is critical for those working in the field. Additionally, specialized training around recognizing and responding to trauma and trauma-informed care practices is needed when working with families impacted by opioid abuse, as there can be long-lasting negative effects for children if trauma symptoms go undetected and untreated.
Promote Workforce Well-Being
Organizations should employ strategies to reduce secondary trauma and burnout in order to promote workforce well-being. Approaches to reducing the adverse effects of include:
- helping staff identify and manage the difficulties associated with their respective positions;
- encouraging self-care and well-being through policies and communications with personnel;
- offering positive coping skills and stress management training; and
- providing adequate supervision and staff coverage.
Encourage Systems Coordination
Families with substance use issues frequently face other risk factors. Collaboration with other service providers is crucial in helping link parents and their children to the services that they need. The surge in opioid use has trickled into a number of child and family-serving systems. As such, agencies should take steps whenever possible to develop partnerships in their communities to support the work.
Allocate Federal Resources
The crisis is too far-reaching to not have a comprehensive, coordinated federal plan of action in place. Despite declaring a public health emergency, we have yet to devote the level of funds that are needed address opioid dependence. While social service providers and child welfare agencies continue to try and mitigate the impact on a local or state level, the importance of allocating appropriate federal resources to support these efforts cannot be overlooked.
For example, the Maternal, Infant and Early Childhood Home Visiting Program (MIECHV) funds home visiting programs that aim to promote positive parenting practices and healthy parent-child interactions. These programs can also link parents struggling with substance dependence to appropriate treatment providers. Research shows that no matter what level of care is needed, the most beneficial approach is the one that treats families together. MIECHV could help address the unique service needs of the growing number families impacted by opioid dependence.
The Family First Prevention Services Act (FFPSA) may also be a way for federal resources to help child welfare agencies respond to the epidemic. FFPSA is poised to dramatically overhaul the child welfare system, putting federal dollars toward prevention programs and interventions aimed at keeping families together. Substance use treatment programs are among the services that can be prioritized through the restructuring of funds. Additionally, given the increased demand for foster care and relative caregiver placements, advocates are calling to strengthen foster parent recruitment and retention efforts and kinship navigator programs. Increasing capacity in these areas will in turn aid child welfare agencies in finding safe, appropriate placements for children impacted by the current crisis.
There are a variety of other ways that programs and policies could provide relief at a national level; however, equally important is the need for improving data collection across various systems to make informed and evidence-based decisions.
The thing about the ripple effect…
It is hard to stop once it gets put in motion. But that doesn’t mean we shouldn’t try. While the current crisis is overwhelming, there are proposed solutions, ones that can positively impact families and change the course for future generations.
We encourage you to share your thoughts on this important issue. How has the opioid epidemic impacted your community and the children and families you serve? What has been the response? Share your feedback in the comments below!