Social Current’s COA Accreditation
Benchmarking Program
Measure Your Organization’s Health and Stability

Through Social Current’s COA Accreditation Benchmarking Program, private and Canadian COA-accredited organizations have on-demand access to live data dashboards that show how they compare to similar human and social service organizations in key performance domains.
This benchmarking program is designed to offer apples-to-apples comparisons that help organizations gauge their health and financial stability and identify areas for improvement. Participating organizations will benefit from a high level of comparison integrity—the extent to which the comparison group matches their organizations.
What value does a benchmark provide a child welfare organization if it was derived from animal rights nonprofits? Our program compares you to your peers.
We offer this by focusing solely on human and social service organizations and using multitiered algorithm to match similar organizations. In addition, we have created very narrow segments or clusters of organizations for even more valuable comparisons and are currently working on the development of custom segmentations for end-users.
Our Measures & Process
Our benchmarking program contextualizes performance on 15 measures within four performance domains:
-
- Financial health
- Governance
- Workforce development
- Risk management
Social Current partnered with leaders in the nonprofit and human/social services field, COA-accredited organizations, and our volunteer peer reviewers to define universal measures of organizational health and stability.
To learn more about each individual measure, access our Benchmarking Measures Overview. This overview lists each measure, its definition and formula, and the related COA Accreditation standard.
Data Collection Process & Report Access
At the end of each fiscal year, COA-accredited organizations submit annual report data. Once their data is submitted, they gain access to that year’s benchmarking report through the MyCOA Portal.
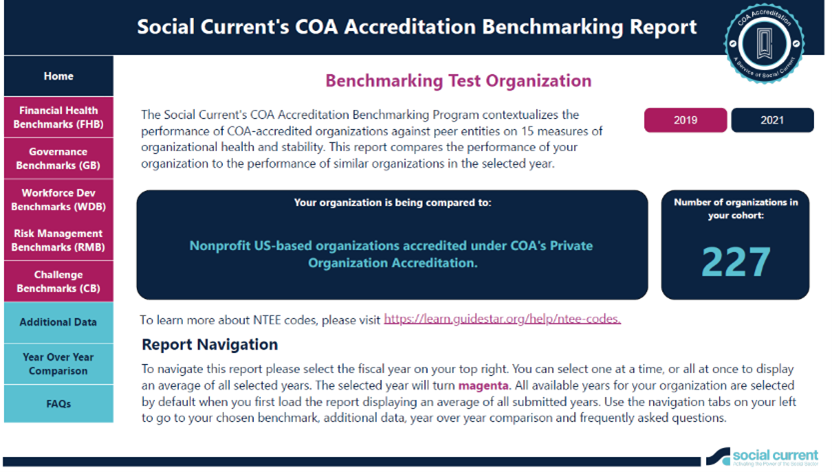
Through the interactive Power BI report, organizations can view relevant information, comparison group characteristics and size, previous years, and different benchmarking measures. Each measure displays how the organization compares to peer organizations as described on their comparison cohort as shown below.
“Always exciting to see more data and see how we can continue to improve our agency. It will be so much better than previous information.”
Questions? Contact the Data Help Team at Social Current.
Benchmarking Sample Report

A video tutorial is available on YouTube and in the MyCOA Portal to take COA-accredited organizations through the new report.
