In 2016, COA began our 2020 strategic planning process. We talked with and surveyed our network on their reasons for seeking COA accreditation and how we could provide even more value to their experience. One recurring theme was the need for data. Our organizations employ sophisticated quality improvement systems to manage their success, but respondents noted a lack of quality external benchmark data to complement their internal data.
History
COA’s pilot benchmarking program launched in the summer of 2016 as part of COA’s Maintenance of Accreditation (MOA) process. It was based on two years of research and replaced our old, narrative-driven MOA process. In the old process, organizations would write an extensive overview of their PQI activities in the past 12 months, and COA would review these narratives and provide feedback. It was a time- and resource-intensive process, and at the end of the day provided little value to COA or our accredited organizations.
We wanted to create a system which had 360-degree value for our network, and this idea was the genesis of the pilot benchmarking program. By collecting, aggregating, and sharing data, we created a system which provided value to all parties:
- COA can better understand our network;
- Organizations are monitoring basic key performance indicators to understand their performance; and
- Our network, as a whole, is enriched with comparative benchmark data.
We started with five measures of organizational health and sustainability: days cash on hand, staff retention rate, management retention rate, average staff tenure, and rate of substantiated grievances. Organizations resoundingly preferred this system and, based on feedback from our network, it surfaced again and again as a priority for us during our strategic planning process for 2020. Based on feedback from our network, we’re enhancing this system to collect and share back even more benchmark performance data.
Goals
We had three primary goals for refining our benchmarking program:
- Universal measures: COA accredits over 60 services and works with a plethora of organizations within the human and social services space. When selecting new measures for this program, we stuck with measures of organization health and sustainability because these are applicable to human and social service organizations of any size or purpose.
- Unlike any other benchmarking services available to our network: we knew we needed a unique benchmarking program which provided:
- Multifaceted measures which gave a holistic view of an organization’s performance
- Segmentation logic. Much of the benchmark data available to our sector is not specific to human and social service organizations. Many times, data is collected from all tax-exempt entities. But, it’s just not valuable for our network to be compared to animal welfare organizations, arts nonprofits, and similar entities. Our program is focused solely on human and social service organizations. In addition, we’re using all of our data to create very narrow segments or clusters of organization for even more valuable comparisons. In future iterations, we hope to roll out custom segmentation for our end-users.
- Improved data collection methodology: as a part of the new MOA process, we’re collecting benchmark data from our network annually and associating it with a discrete fiscal year. This ensures we have a consistent and reliable flow of data to share back with our network.
New Benchmarking Program
Starting in 2020, all organizations accredited under COA’s Private and Canadian organization accreditation will provide data via an Annual Report. This report is due 60 days after the start of your fiscal year and collects data on your prior fiscal year. It is part of our Maintenance of Accreditation process, and organizations must complete this report to maintain their accredited status. Here’s how the process will work:
- COA will notify your organization’s primary contact 60 days before the Annual Report is due. This should land around the first day of your new fiscal year.
- Once this notification is received, organizations can access their Annual Report cycle via their MyCOA Portal.
- The MyCOA Portal has step-by-step instructions for gathering and inputting the requested data.
Step-by-step guide to completing the Annual Report
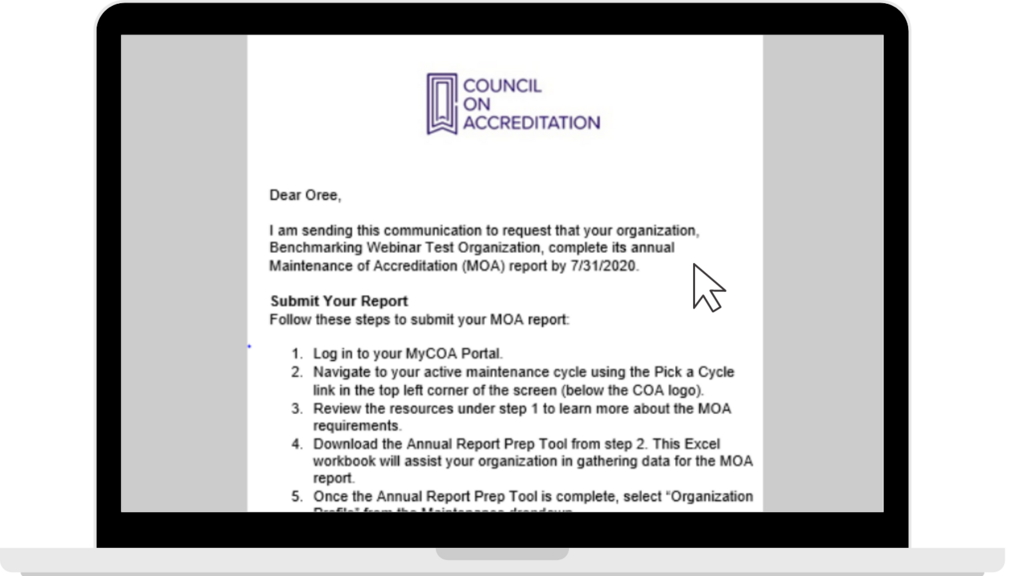
Around the start of your fiscal year, your organization’s primary contact will receive an email inviting you to complete your Annual Report. It will list the due date and steps for completing the report.
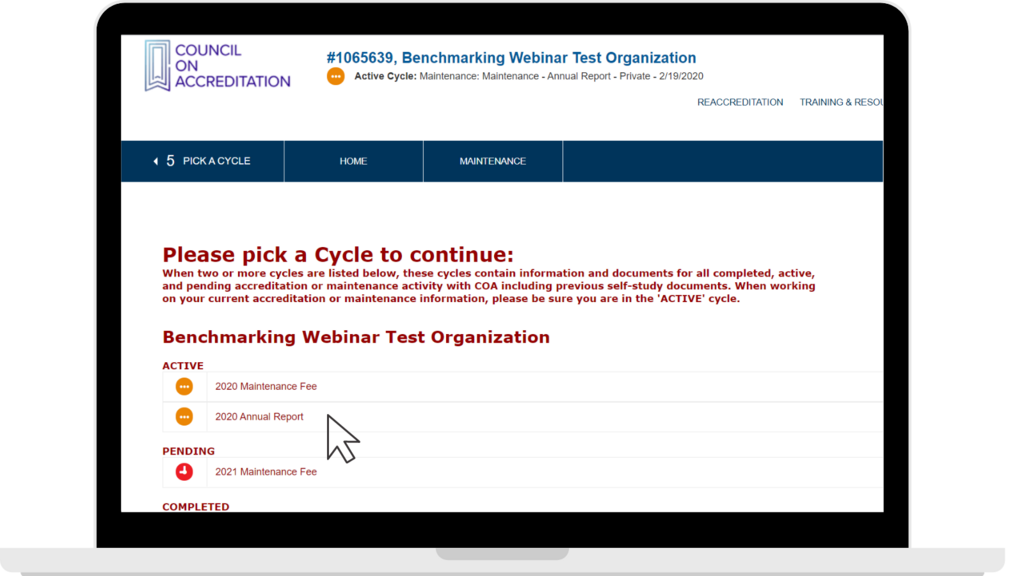
Next, log in to your MyCOA Portal. Use the Pick a Cycle link to navigate to the correct cycle. In this example, the organization’s Annual Report is currently due. In addition, the organization has 2 Maintenance Fee cycles in 2020 and 2021; for these cycles, only the Maintenance Fee is due. To complete the Annual Report, select “2020 Annual Report.”
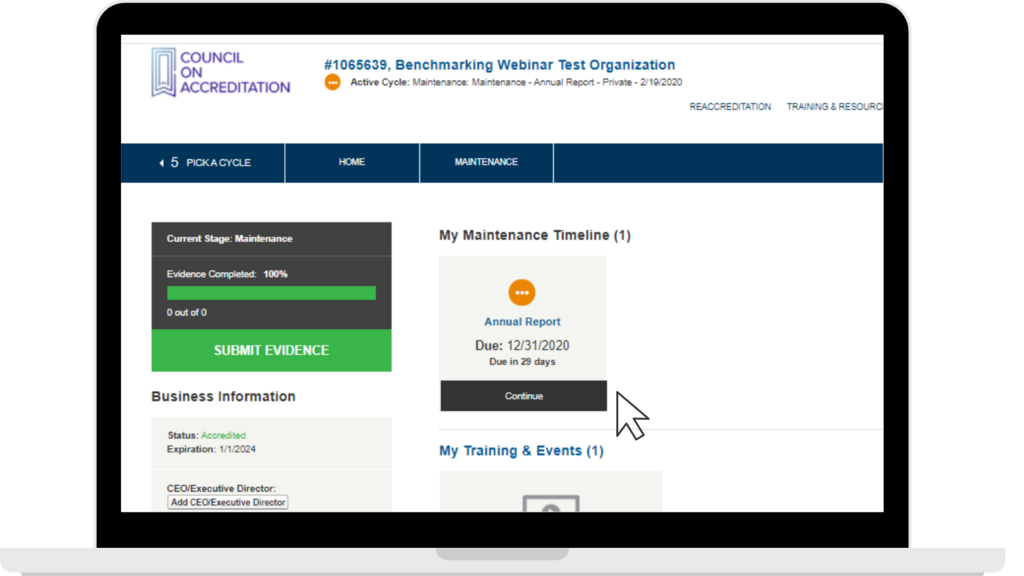
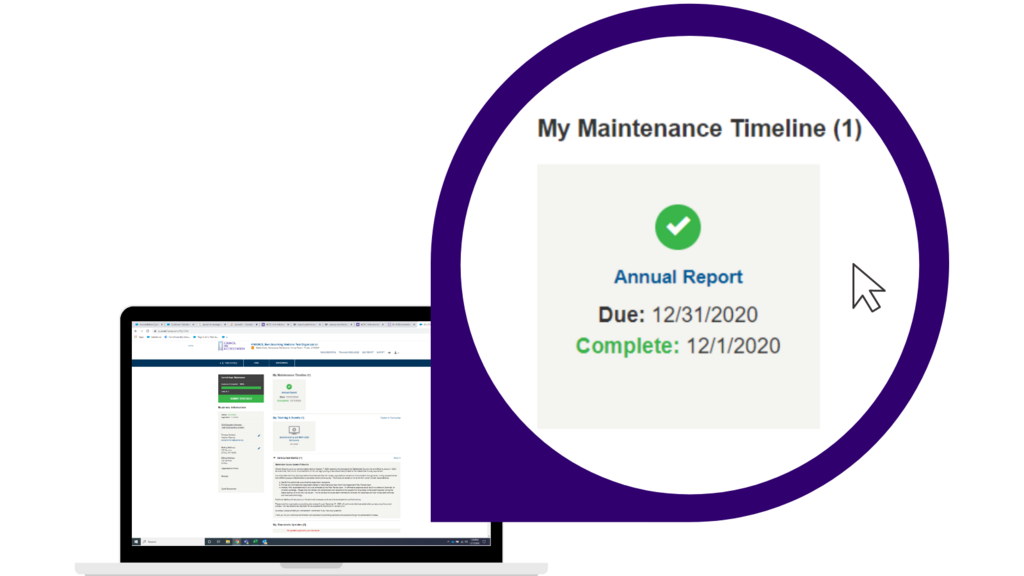
On this page, the timeline will show when the Annual Report is due – in this case, on 12/31/2020. Select “Continue.”
This page gives a step-by-step overview of how to complete the Annual Report.
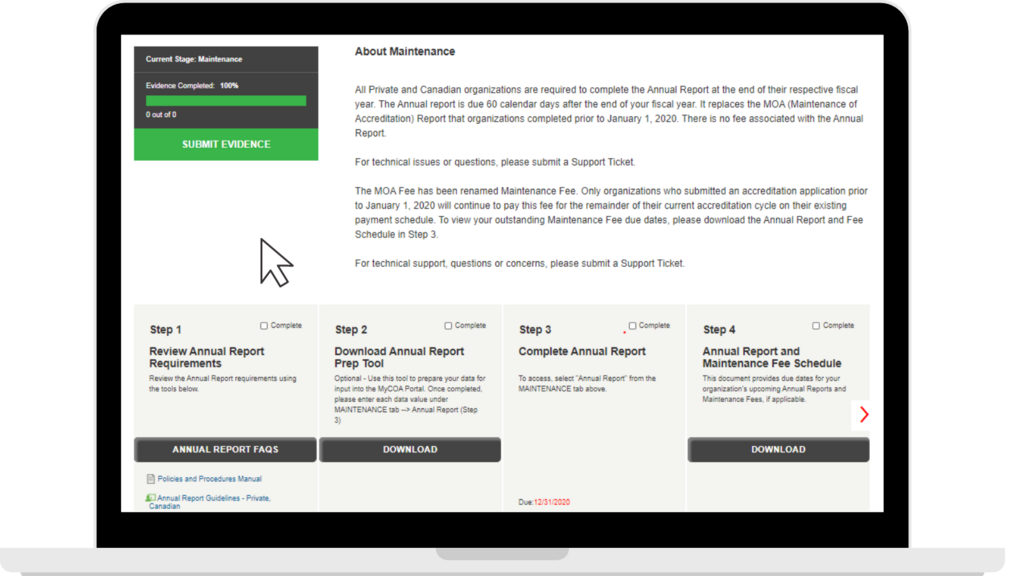
Step 1
If you’d like, you can review the Annual Report requirements and FAQs using the links in Step 1.
Step 2
COA understands that, oftentimes, only one or two staff have access to the MyCOA Portal. So, we created the Annual Report Prep Tool to help you gather your data before inputting it into the MyCOA Portal. Click the DOWNLOAD button in step 2; COA will merge any data we may already have into this document so you’re not doing duplicative work. Share the Prep Tool with relevant staff to gather your data. Please note the completion of the Prep Tool is optional. The Prep Tool is for internal records only and does not need to be submitted to COA.
Step 3
In order to complete the Annual Report, all data must be submitted electronically in your MyCOA portal. Hover over the MAINTENANCE tab in the top toolbar, and select “Annual Report from the dropdown menu.
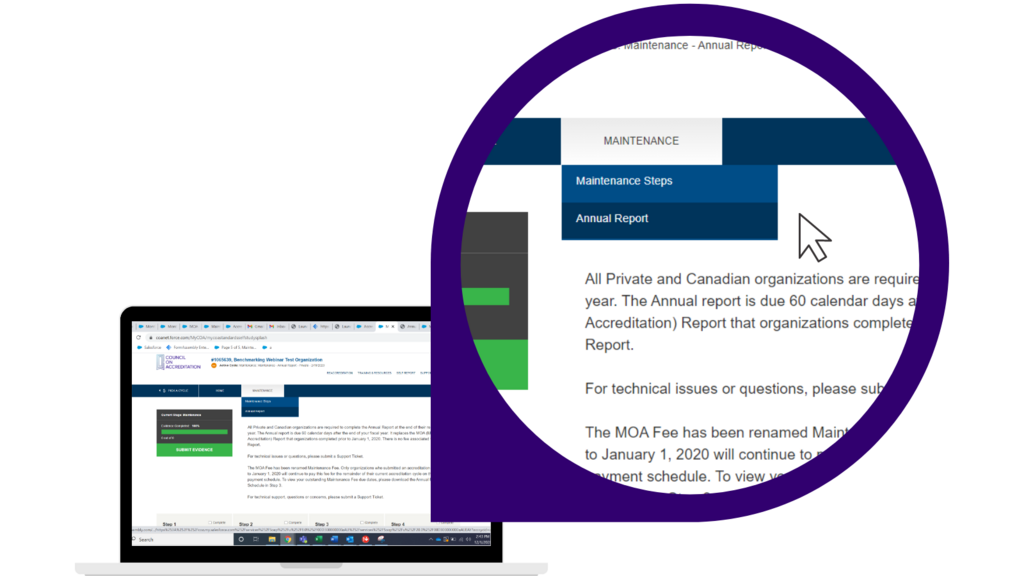
This will open the Annual Report electronic submission form.
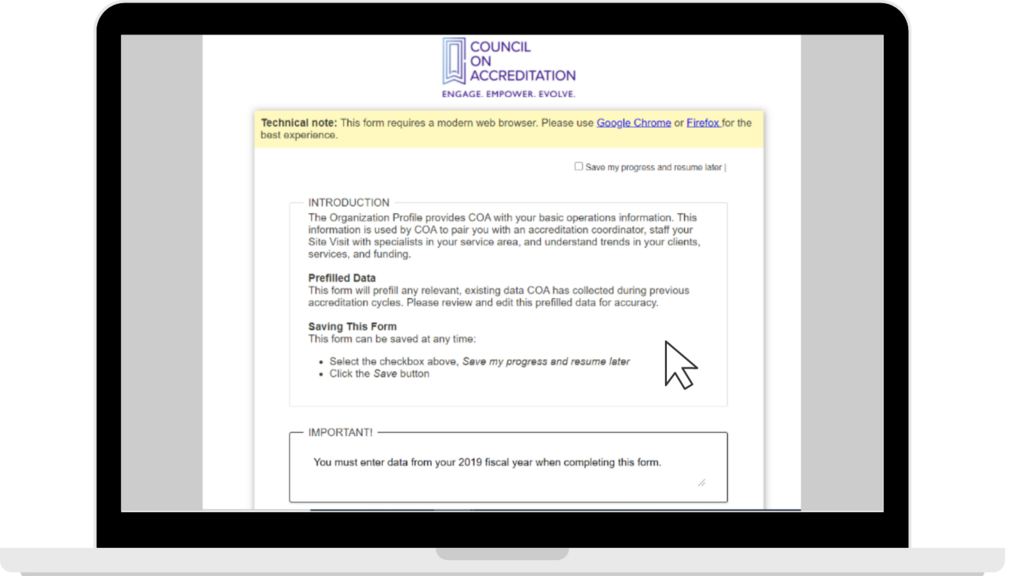
If you used the Prep Tool, copy the information from the Prep Tool into this form. You’ll notice that the questions are in the exact same order as in the Prep Tool. You can save at any time by click the “Save my progress and resume later” checkbox in the top right corner and then the Save button.
Once all information is entered, click the Submit button at the bottom of the form.
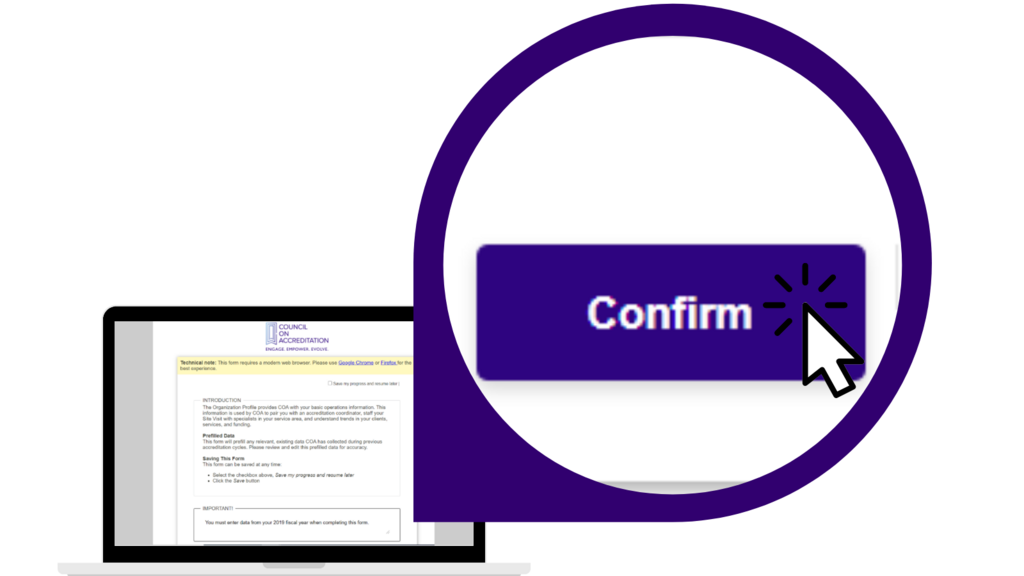
On the following page, confirm the accuracy of your data. Then, click Confirm to fully submit your data. At this point, you can also select “Print this page” to print a copy of your report for your records.
Once the data is submitted, the card on your Milestone Timeline will indicate the completion date and you are done with your submission! Please note: If you would like to make any changes to your submission, please submit a Support Ticket in the MyCOA portal.
The Benchmark Report – available Q1 2021
Once COA receives all data from accredited organizations for a particular fiscal year, we’ll unlock the benchmark report and allow you to access it from within your MyCOA Portal. Download a sample benchmark report here.
Segmentation Logic
The benchmark report uses segmentation logic to create a comparison group of organizations like yours; we then use this group to calculate your benchmark figures. We use data on your business type (nonprofit or for–profit), services provided, revenue, and geographic location to construct this group and ensure an apples-to-apples comparison. We want to provide you with data which has the utmost “comparison integrity” so you can be confident the benchmarks are meaningful to you.

The cover page indicates the fiscal year to which the report pertains, describes the group of organizations against which your organization is compared, and lists the publication date – the date on which the report was generated.
The characteristics of your organization are used to generate the comparison group. The sample organization receiving this report is a nonprofit organization accredited under COA’s Private Organization Accreditation program and provides foster care services with a revenue between $5-10M. When generating your benchmark data, then, we pulled data only from organizations which fit these characteristics. This ensures the comparisons made in this document are valuable to the sample organization.
The following pages organize all benchmark metrics into their domains. First, we have the FINANCIAL HEALTH BENCHMARKS: each metric is given a title, a description of what it is and why it is important, and a chart comparing the sample organization’s data to the average value of its comparison group. In this top metric, Months of Liquid Unrestricted Net Assets or LUNA, the sample organization and its comparison group had 6 months of LUNA, so the sample organization can be confident that its liquidity – as measured by LUNA – is within normal range for their type of organization.
Each subsequent page lists measures belonging to a particular performance domain, and follows the same structure: title, description, and a chart comparing your data against your comparison group.
Scrolling down, the ADDITIONAL DATA page shows all of the sample organization’s data and the comparison figures in one view. We also provide the Percent Rank for each metric. The Percent Rank locates your organization within the comparison dataset. For example, the sample organization’s Months of Liquid Unrestricted Net Assets has a percent rank of 33.3%. This means that the organization’s Months of LUNA was higher than a third of organizations but lower than two-thirds of organizations in the comparison dataset. Percent rank is just another way of showing you how you compare to similar organizations.
The final page lists some FAQs. As your questions come in, we’ll update this page with more information for reading and understanding your benchmark report.
Additional information
We have created a custom website with further information about COA’s benchmarking program at www.coameasures.org.
If you missed our benchmarking webinars, please feel free to view the recording here.
If you have any further questions about changes to the maintenance of accreditation process, please feel free to contact Ingrid Zamudio, Data Science Manager. For questions specific to your organization, please submit a support ticket in your MyCOA portal.
